
Systematic Trading—June 2026 Update
Performance of monthly, weekly, and daily strategies


Performance is without any leverage. All performance metrics are calculated based on the applicable trading timeframe.
Comments
Systematic trading faced challenges in June due to a rise in volatility, which was driven by geopolitical developments and higher inflation. Large-cap stocks (SPY) fell 1%, gold (GLD) cratered 11.7%, and commodities (DBC) plunged 9.6%. Alternative assets also fell, with managed futures (DBMF) down 0.8% in June, while bitcoin (IBIT) crashed 20%. Convexity scarcity in June led to higher-than-normal stress in some systematic strategies, but the ensemble used in our weekly reports managed to gain 2.2% due to a surge in the momentum factor and gains in the value factor.
Daily mean reversion in E-mini futures delivered a gain of more than 12% in June. Overall, daily and weekly mean reversion exhibited robustness in June, with a gain of 2.2% for Dow-30 stocks (Weekly Signals). Unexpectedly so, long-short suffered in June, with the Dow-30 strategy falling 2.7%. Asset cross-section momentum got hit with a 3.6% loss due to a reversal in commodities. The same reversal also negatively impacted monthly strategy performance.
We expect the volatility to remain elevated in July due to rising geopolitical and economic uncertainty.
Monthly Signals
Hybrid Asset Allocation
The hybrid asset allocation ensemble of two strategies (HAA) fell 2.6% in June after gaining 1.2% in May and surging 5.5% in April. The ensemble is up 9.2% year-to-date.
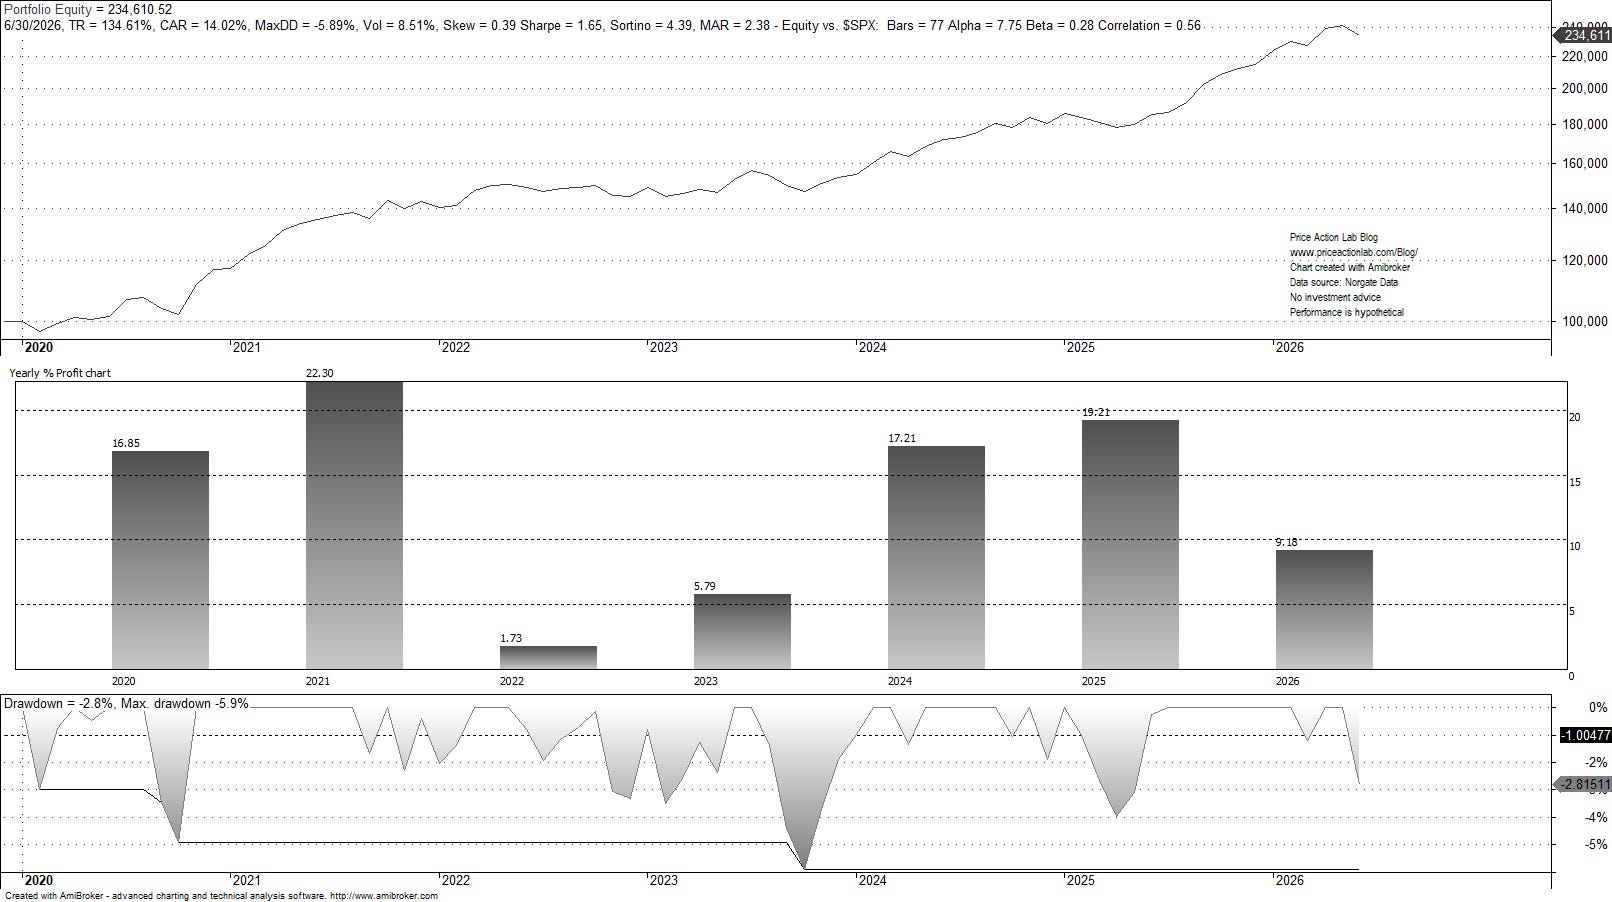
Since 2020, the Sharpe ratio of HAA is 1.65 versus 0.92 for the buy-and-hold SPY ETF. The risk-adjusted alpha is 7.5%, and beta is 0.28. Maximum drawdown is only 5.9%. Click here for more details and the last update on June 30, 2026.
Dynamic momentum
Dynamic momentum (DYNMOM) fell 1% in June after gaining 5.3% in May 2026 and surging 10.5% in April 2026. The strategy is up 10.1% year-to-date, due to tracking the SPY ETF since May of last year.
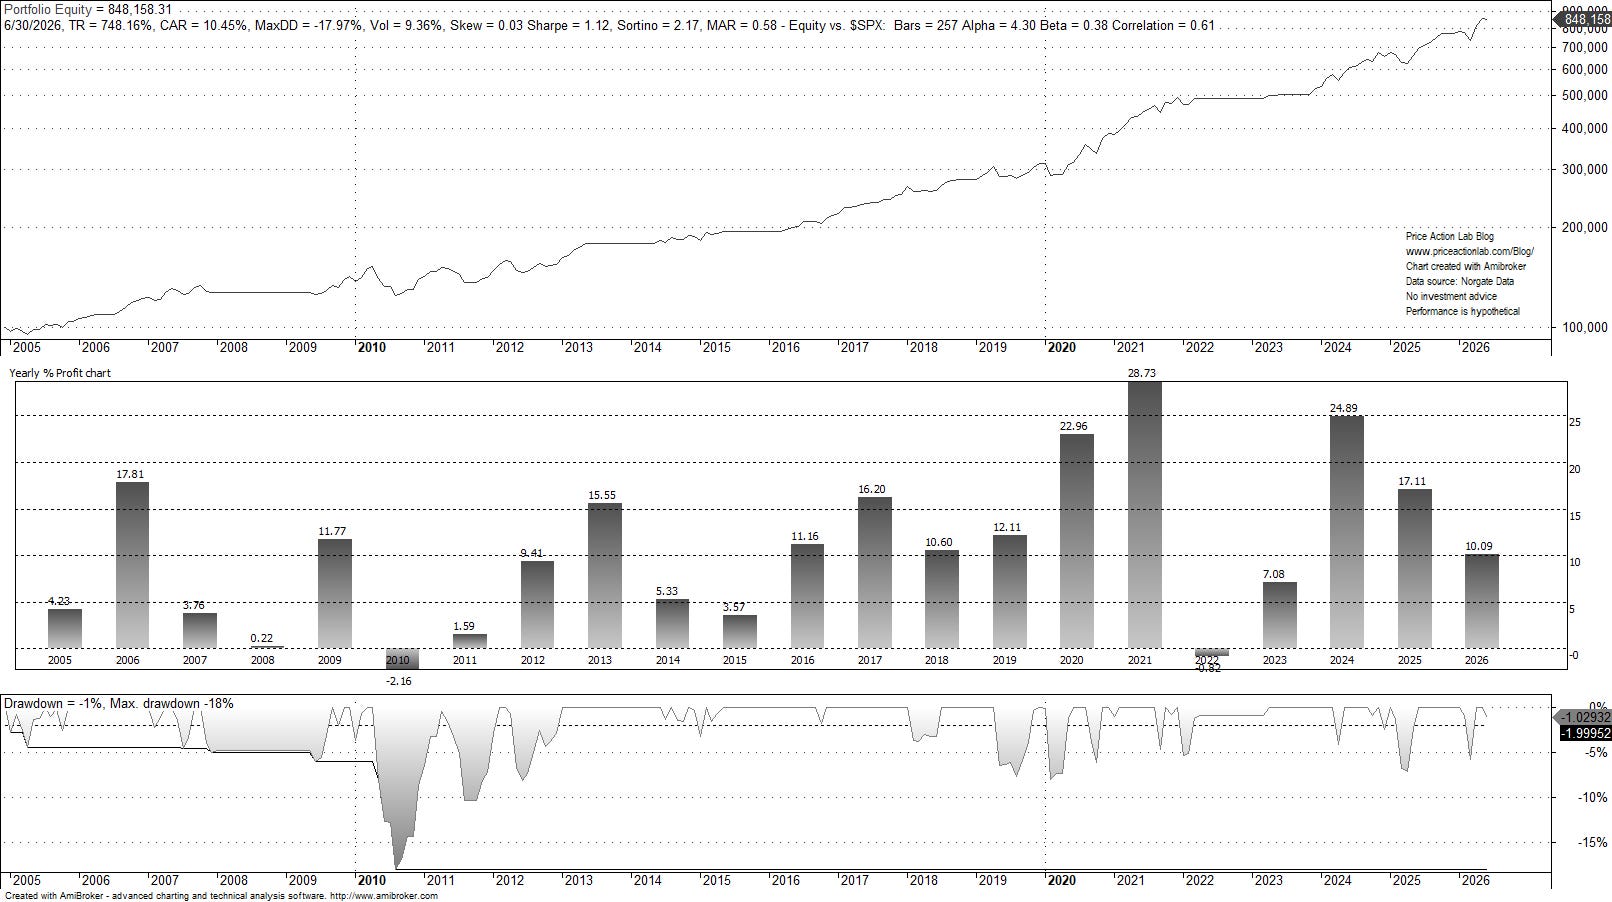
Since the inception of the SPY ETF, the Sharpe ratio is 1.12. The risk-adjusted alpha is 4.3%, and beta is only 0.38. The maximum drawdown is 18%. Click here for the last monthly update on May 29, 2026.
Weekly Signals
1. The ensemble of the six strategies fell 0.5% in June 2026, +7.3% YTD.
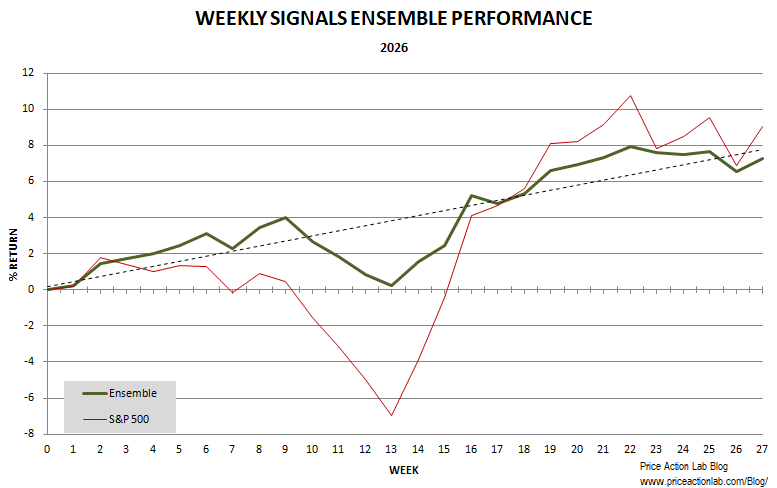
The ensemble of the six strategies has achieved its primary objective, which is high risk-adjusted returns, while targeting a volatility of no more than 8%.
2. The ensemble of the two strategies in our weekly reports gained 2.2% in June after gaining 2.8% in May. The ensemble is up +22.9% for the year (+20% when returns are calculated on a year-to-year basis after rebalancing.)
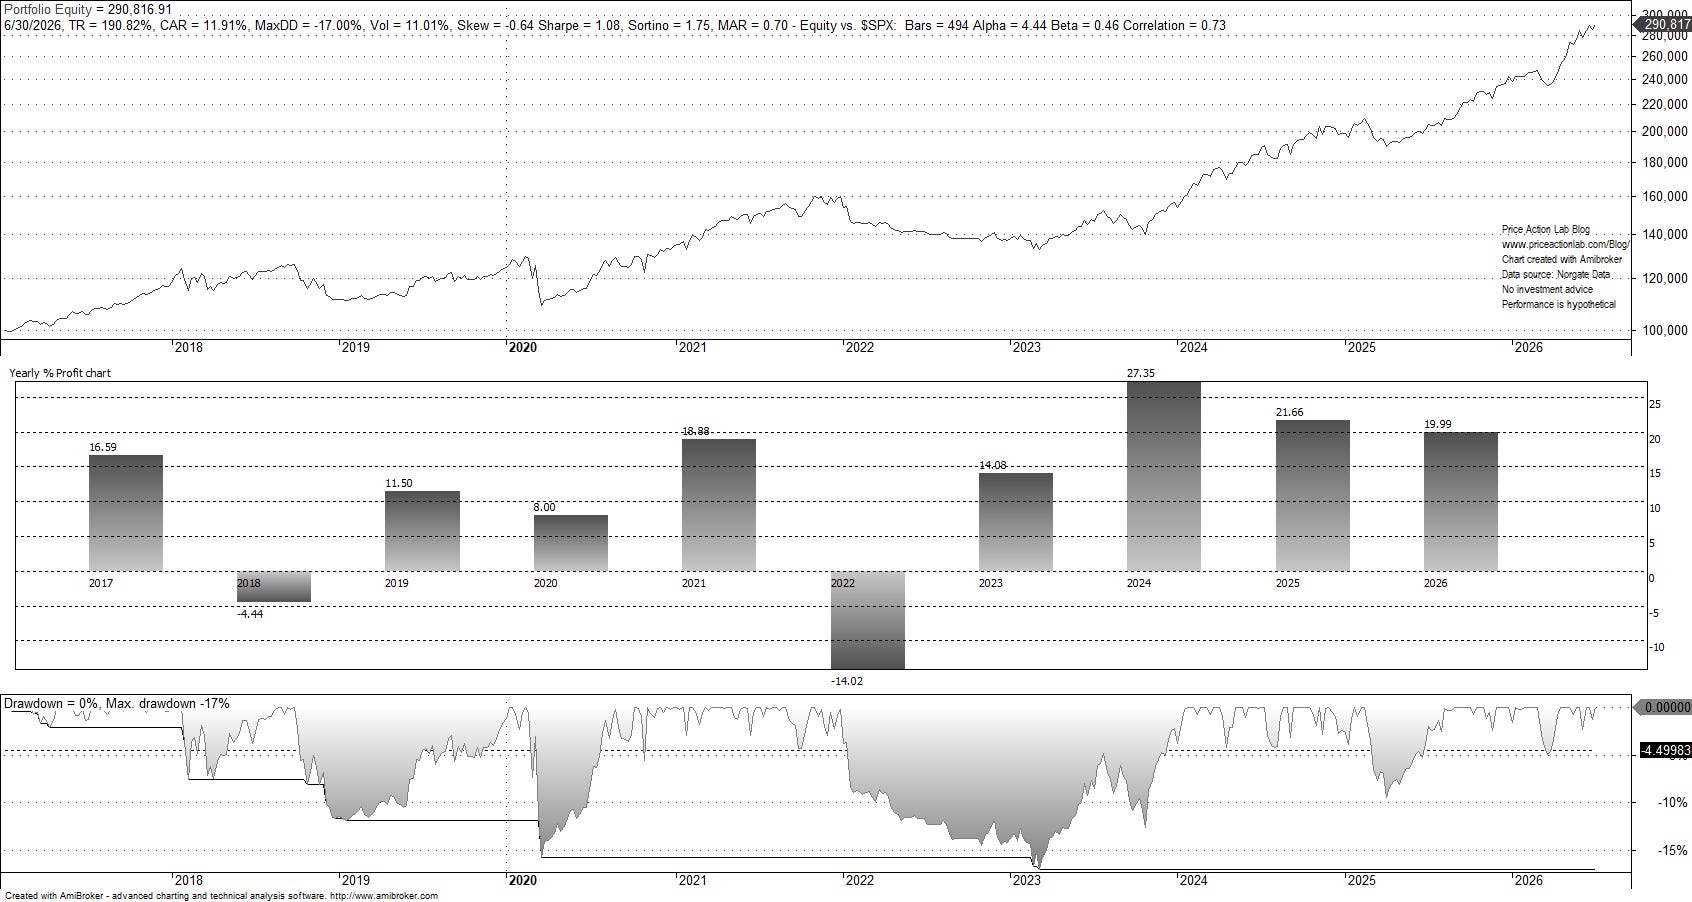
The Sharpe ratio is 1.08. The risk-adjusted alpha is 4.4%, and beta is 0.46. The maximum drawdown is 17%. Click here for the last report on May 29, 2026.
Daily Signals
1. Daily mean reversion fell 0.6% in June 2026 and is up +6% YTD. Below is the equity performance since the start of the daily mean reversion signals subscription on June 27, 2023. Note that occasionally, daily mean reversion makes use of 2x leveraged ETFs.
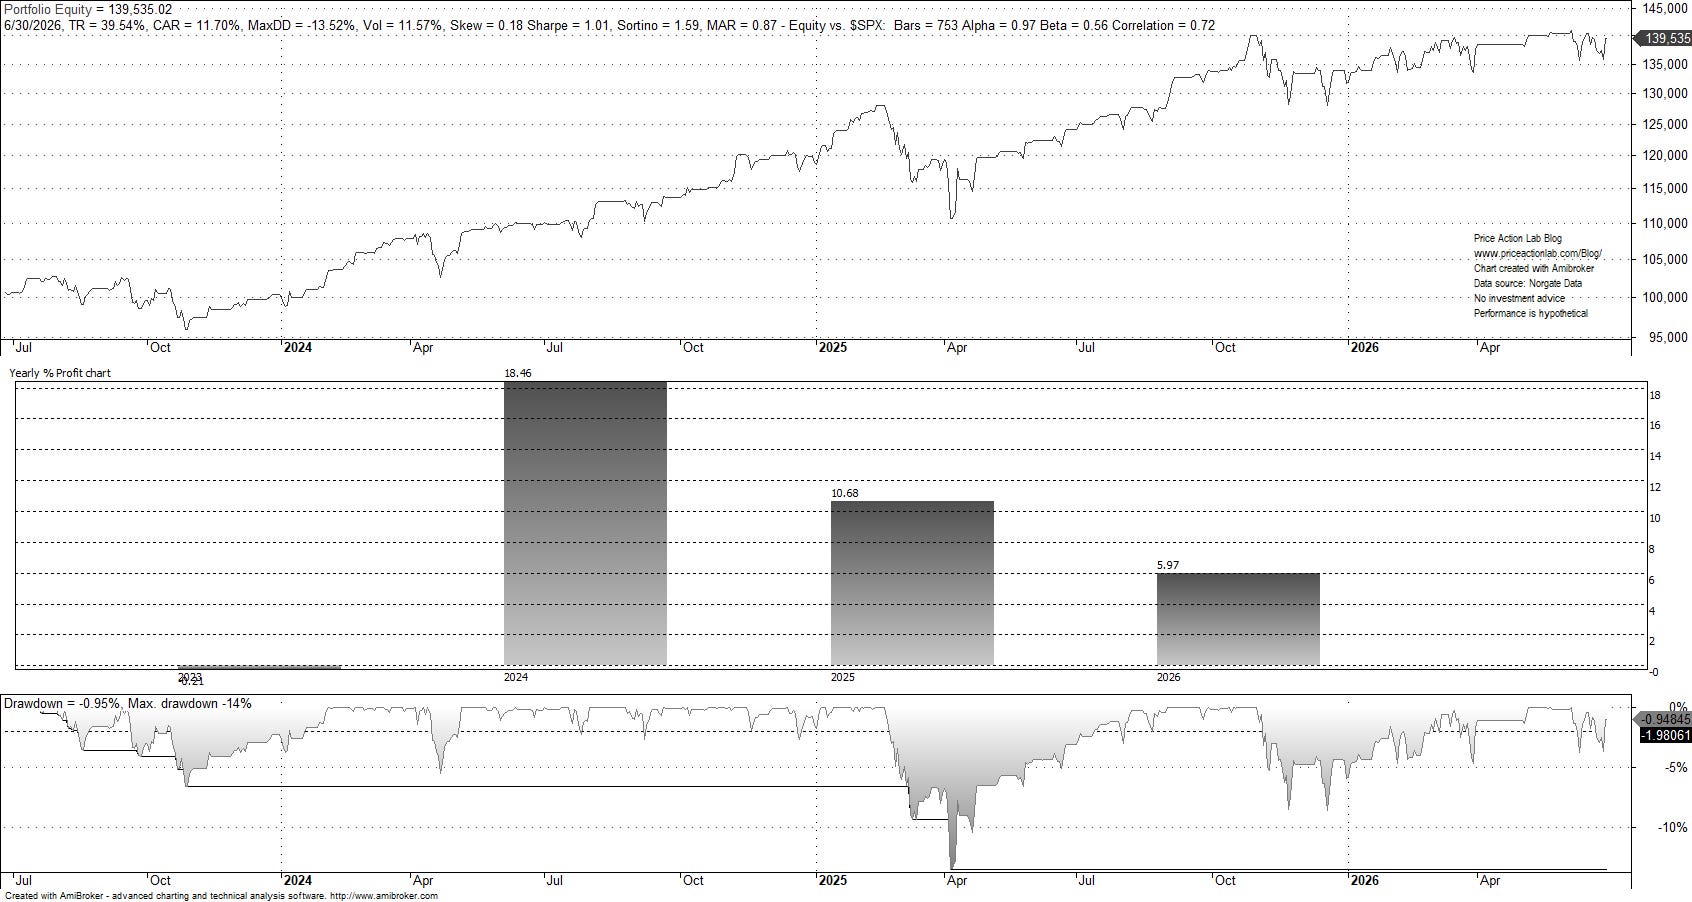
The Sharpe ratio is 1.01, and the maximum drawdown is 13.5%. Click here for the latest update and for the performance of two bonus strategies.
2. Momentum and mean-reversion switching gained 1.1% in June 2026 and is up +9.7% YTD. Below is the equity performance since the start of the daily mean reversion signals subscription on October 9, 2025.
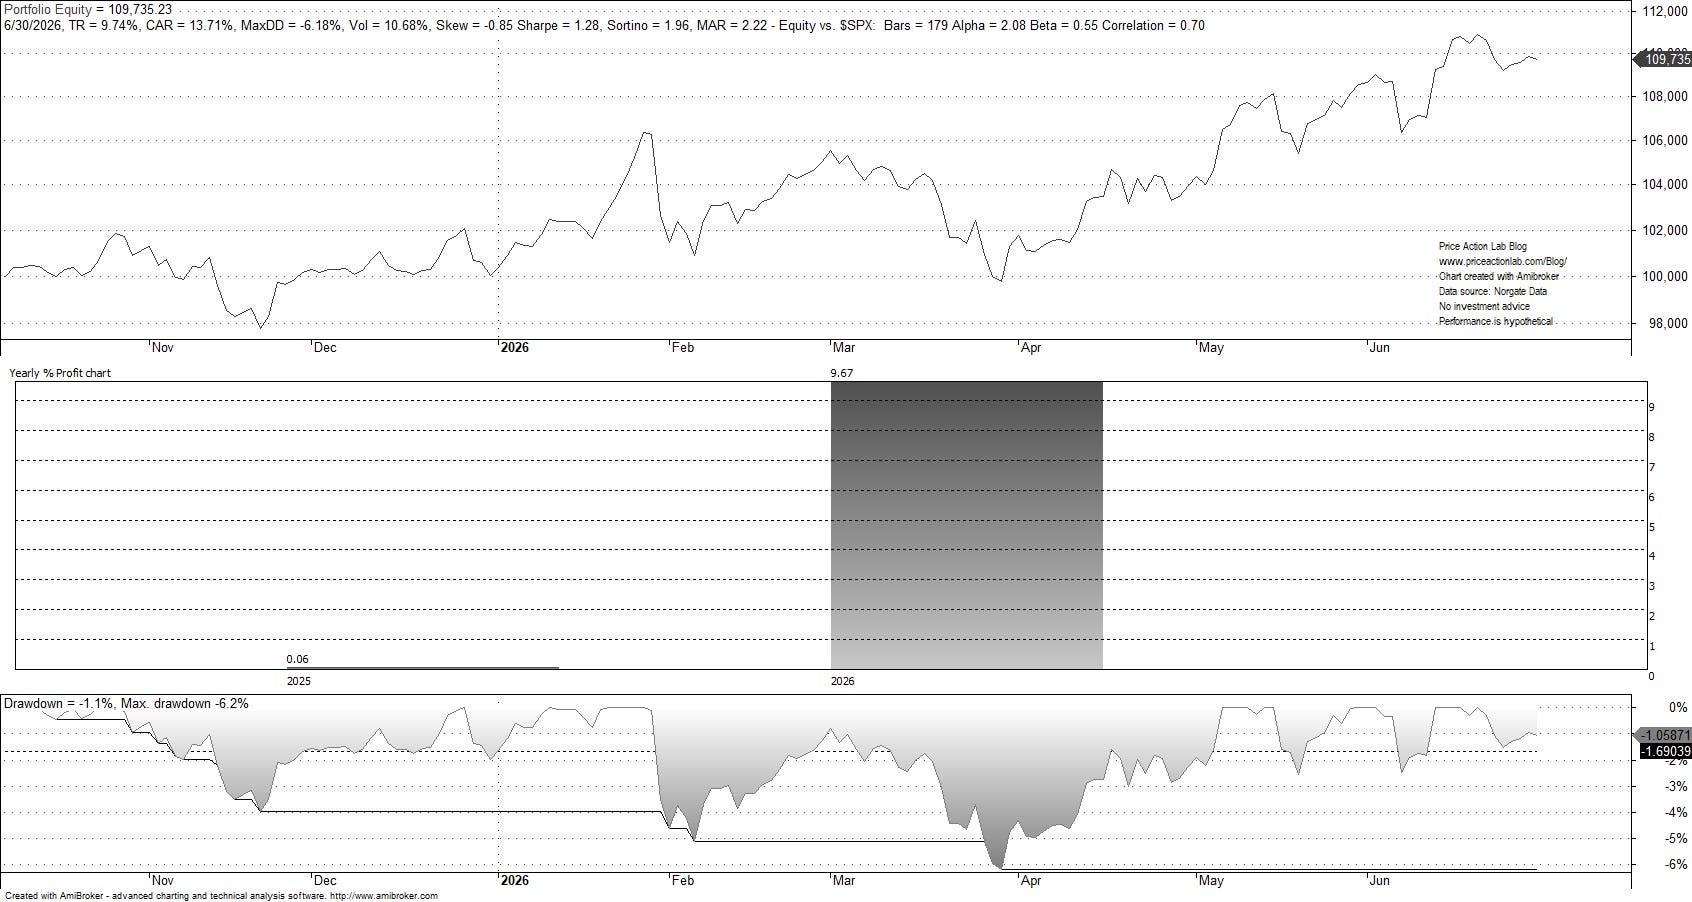
The Sharpe ratio is 1.28, and the maximum drawdown is 6.2%. Click here for the latest update.
3. E-mini futures mean-reversion gained 12.6% in June 2026. Below is the equity performance since the start of the daily mean reversion signals subscription on May 21, 2025.
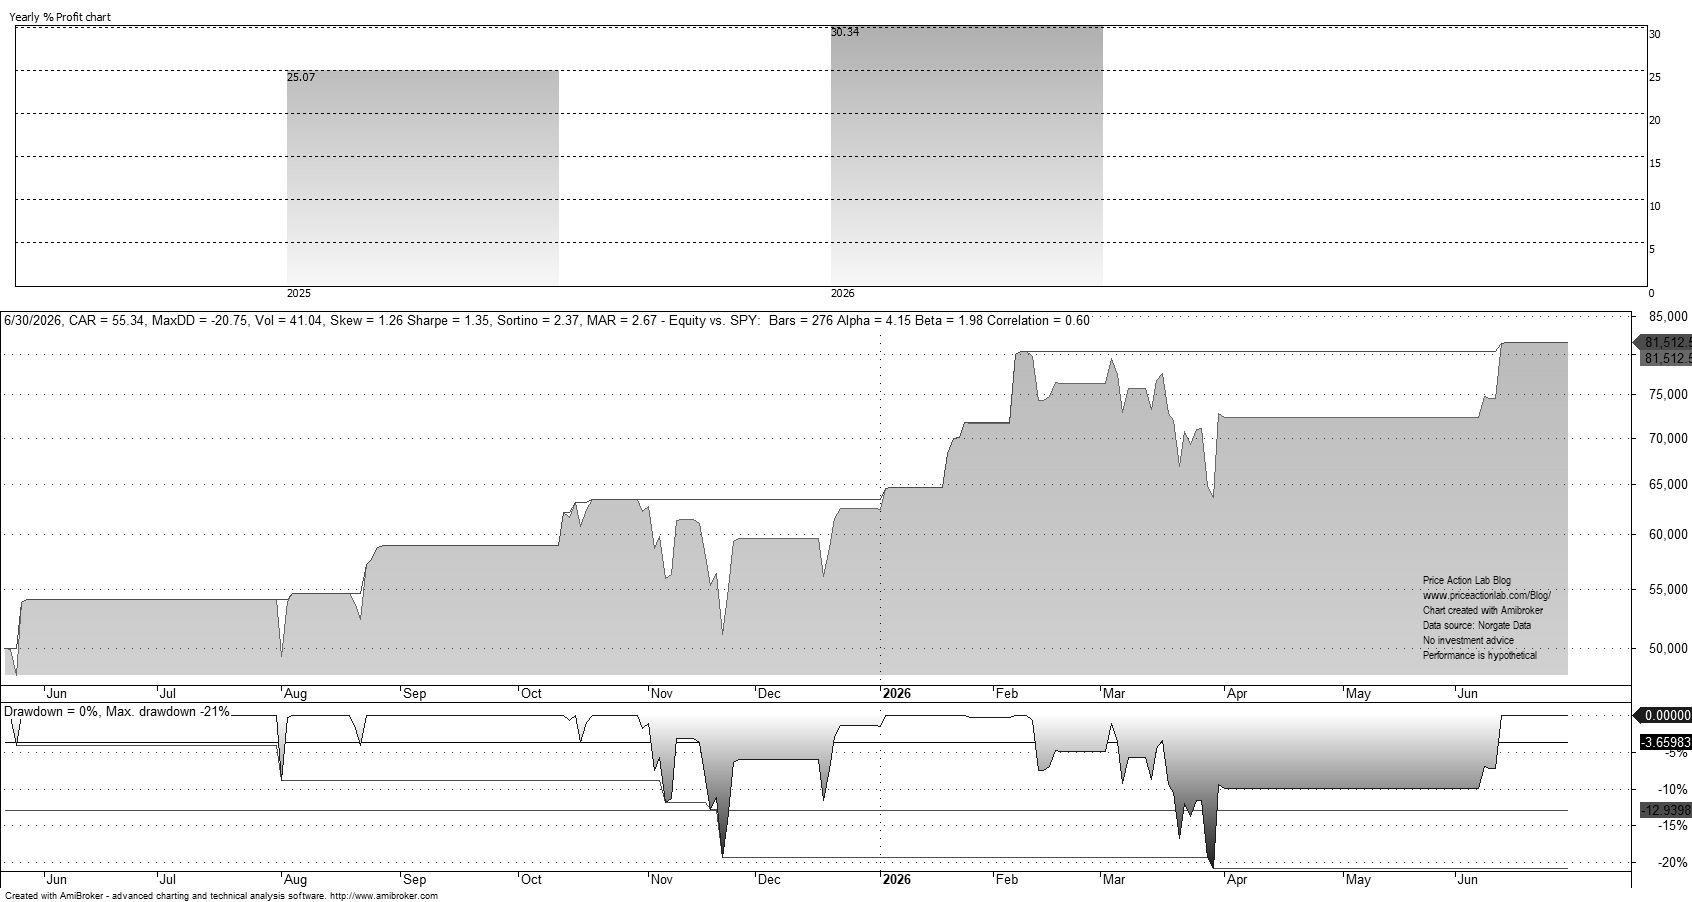
The Sharpe ratio is 1.35, and the maximum drawdown is 21%. Click here for the latest update.
Transparency Statement and Disclaimer
Our daily, weekly, and monthly signals are transparent about signals and positions, and there is no ambiguity. We report all entries and exits in advance for the open of the following day, week, or month. We do not make vague claims about entries and exits depending on whether the price action was favorable or not. No ambiguity, no buzzwords, no macro analysis: well-defined entry and exit signals for major and liquid ETFs and equities from robust systemtic strategies.
The monthly, weekly, and daily signals are available on the Price Action Lab Blog. The weekly two-strategy ensemble signals are also available in our weekly report on Substack.
The signals are provided for informational purposes only and do not constitute investment advice or actionable content. We do not warrant the accuracy, completeness, fitness, or timeliness of the signals for any particular purpose. Under no circumstances should the strategies be treated as financial advice.
Strategy Package
The purpose of the package is to provide informational content that aids in the development of trading strategies towards becoming a professional trader or even establishing a hedge fund. The package provides the rules for a total of 16 trading strategies plus the PSI5 algorithm.
Charting and backtesting program: Amibroker. Data provider: Norgate Data