
Weekly Market Report: Biotech
June 29, 2026


Weekly Market Report
Performance of tactical ensemble and strategic allocation
Price action analysis, weekly market summary, and market forecast
Details of tactical ensemble and strategic allocation
Market dynamics discussion and conclusion
Section 2 covers trends in asset performance. We look at popular ETFs, current market rotation trends, low volatility versus high beta performance, and the perils of using a technical indicator that has historically generated false signals.
Section 3 offers details about the performance of our tactical and strategic allocations.
Section 4 discusses the recent performance in biotech and potential drivers.
1. Performance of tactical ensemble and strategic allocation
Summary
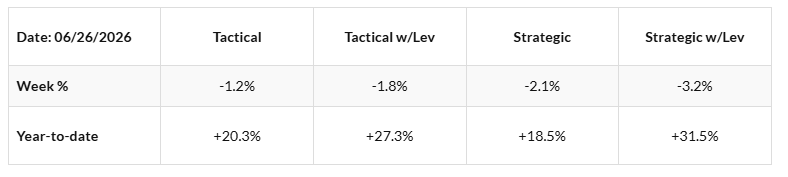
For the week ending Thursday, June 26, 2026:
The weekly strategies tactical ensemble (WRE) fell 1.2% with equal allocation. Year-to-date: +20.3%
The Price Action Lab strategic allocation (PALSA) fell 2.1%. Year-to-date: +18.5%.
The SPY ETF fell 2.4%. Year-to-date: +7.5%
For the open positions and any new signals of WRE, see Section 3. The WRE (Lev) tactical allocation is up 27.3% year-to-date with 1.6x leverage to match the SPY ETF volatility. We also include the PALSA strategic allocation details and the performance when the volatility matches that of the SPY ETF, with 1.7x leverage, which is up 31.5% year-to-date.
2. Price action analysis, weekly market summary, and market forecast
Starting with this week’s report, we bring back the cash indices for our weekly recap, and we also focus on our watchlist of 32 popular ETFs. We will also start paying attention to key divergences in asset and index performance because the signal-to-noise ratio could be higher during market stress periods than that of price action indicators.
We start with a chart of a popular quantitative indicator of the relative performance of two indices, which is regularly featured in financial social media and the blogosphere, but it is a tricky one that can generate misleading results. Then, we focus on the relative performance of the two indices.