
Systematic Trading Update—2025 Update
Performance of monthly, weekly, and daily strategies


Monthly Strategies
Hybrid asset allocation (HAA) ended 2025 with a 19.2% gain. Click here for the last monthly update on December 31, 2025.
HAA employs two strategies: asset cross-sectional momentum and strategic allocation. Both strategies use ETFs to generate signals.
Dynamic Momentum (DYNMOM) gained 17.1% in 2025. Click here for the last monthly update on December 31, 2025.
DYNMOM is a proprietary timing algorithm that trades the SPY ETF. Its objective is to maximize the Sharpe ratio and avoid market corrections. The strategy generates signals on a monthly basis.
Weekly Strategies
The ensemble of the six strategies gained 10.3% in 2025, with a maximum drawdown during the year at 5.2%.
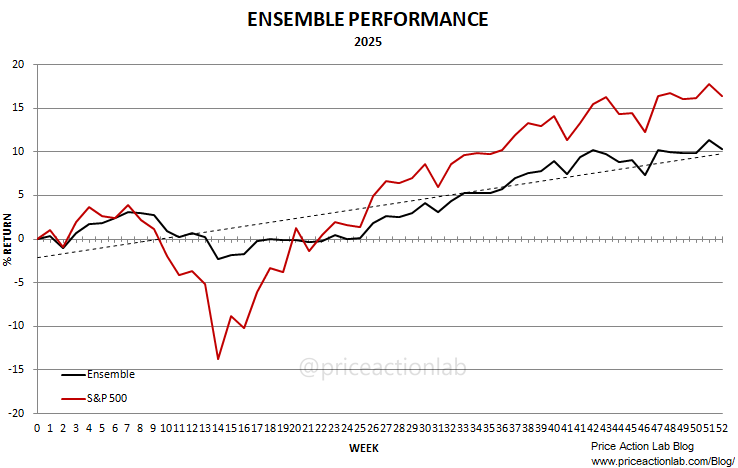
On a volatility-adjusted basis, the ensemble outperformed the benchmark by a factor of more than 2. Specifically, in the weekly timeframe, the volatility of the ensemble was about 7% versus 17% for the S&P 500 index. The Sharpe ratio of the ensemble in 2025 was about 1.4 versus 0.9 for the benchmark.
Click here for the latest update.
Daily Strategies
1. Daily mean reversion gained 10.7% in 2025, with a maximum drawdown of 14%.
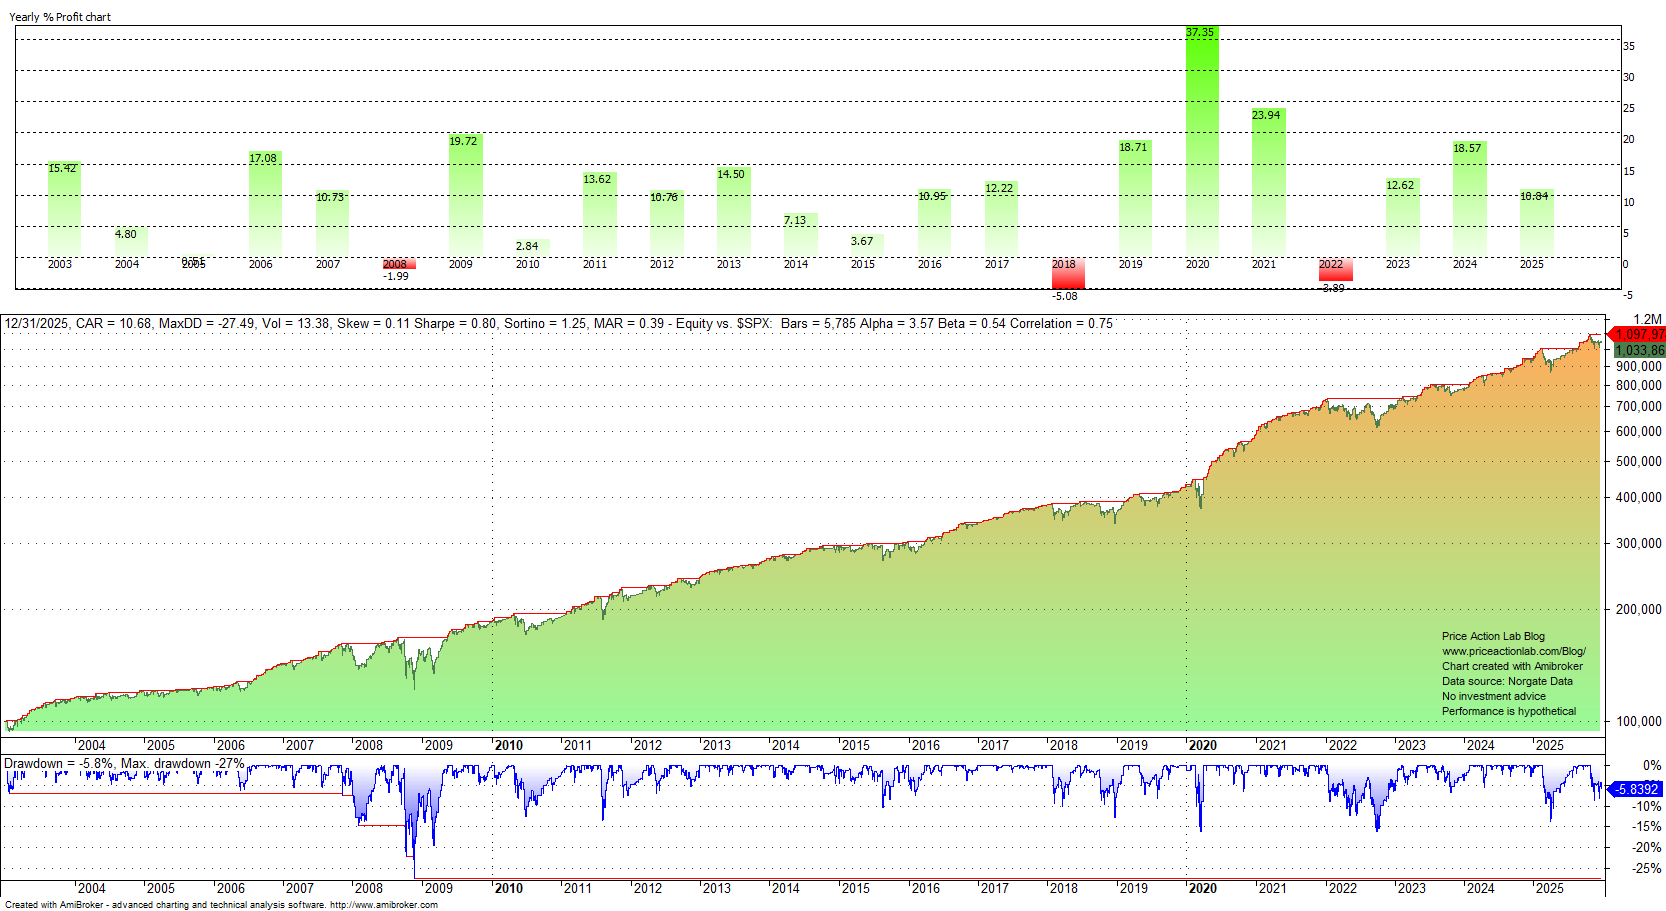
The mean-reversion strategy is based on our PSI5 and MR5 algorithms and generates long-only signals for ETFs in the daily timeframe.
Click here for the latest update.
2. The Dynamic-3 bundle gained 16.5% in 2025, with a 5% maximum drawdown.
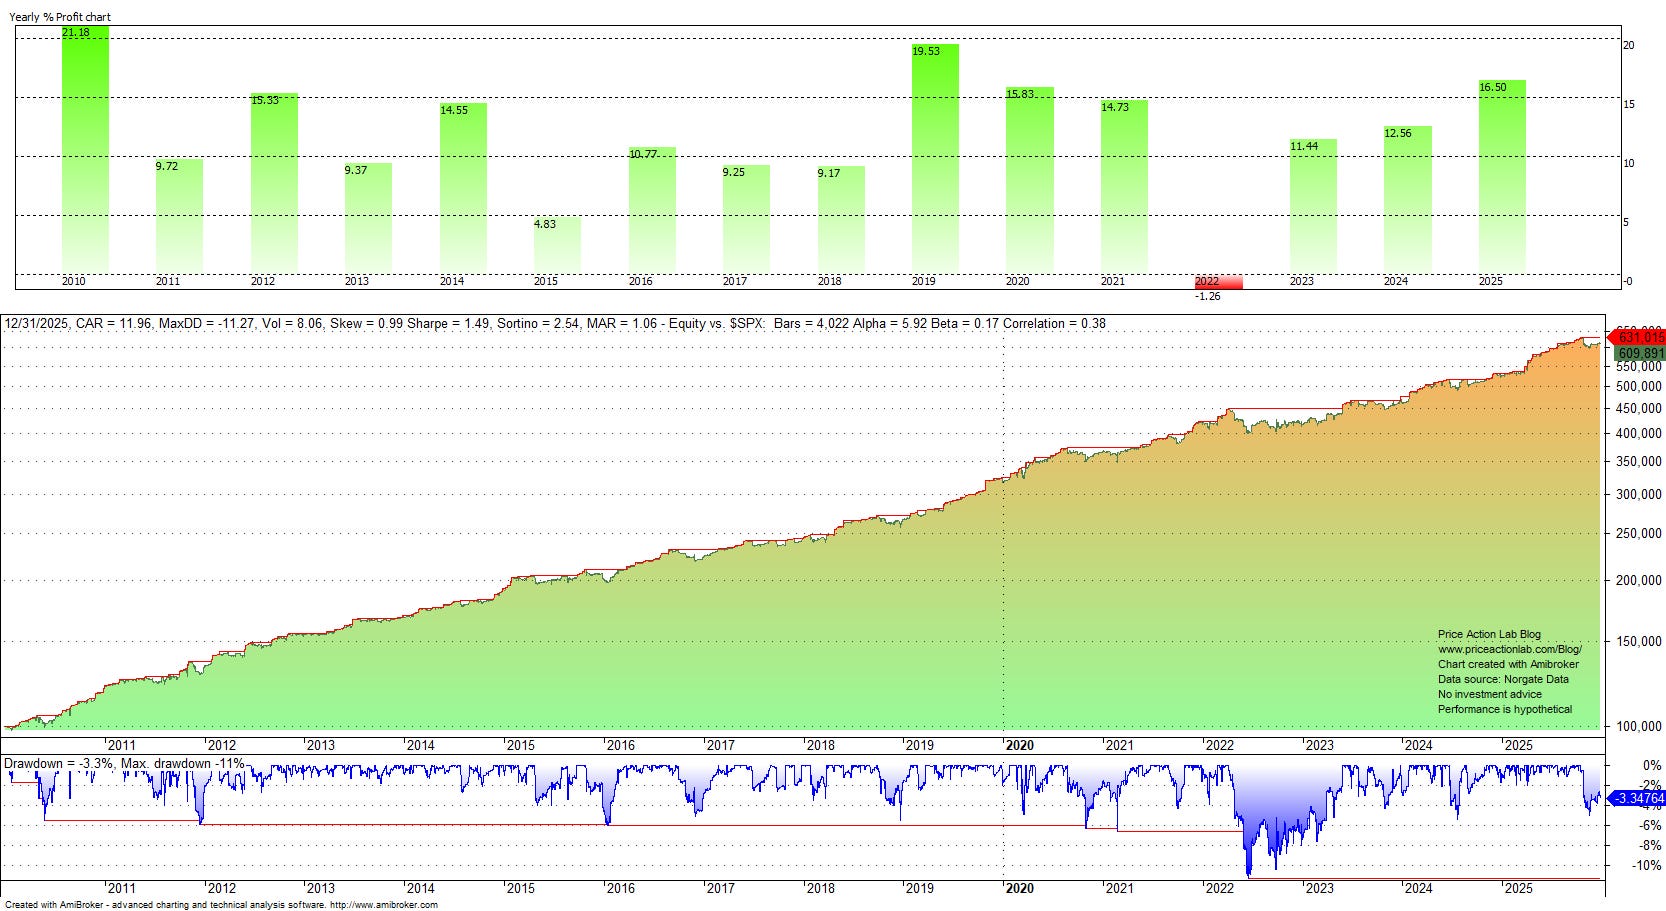
The Dynamic-3 bundle includes the rules of three strategies. These long-only strategies operate in the daily timeframe.
Since 2010, the Sharpe ratio is 1.49, the annualized return is 12%, and there is only one down year with a 1.3% loss. Click here for more details.
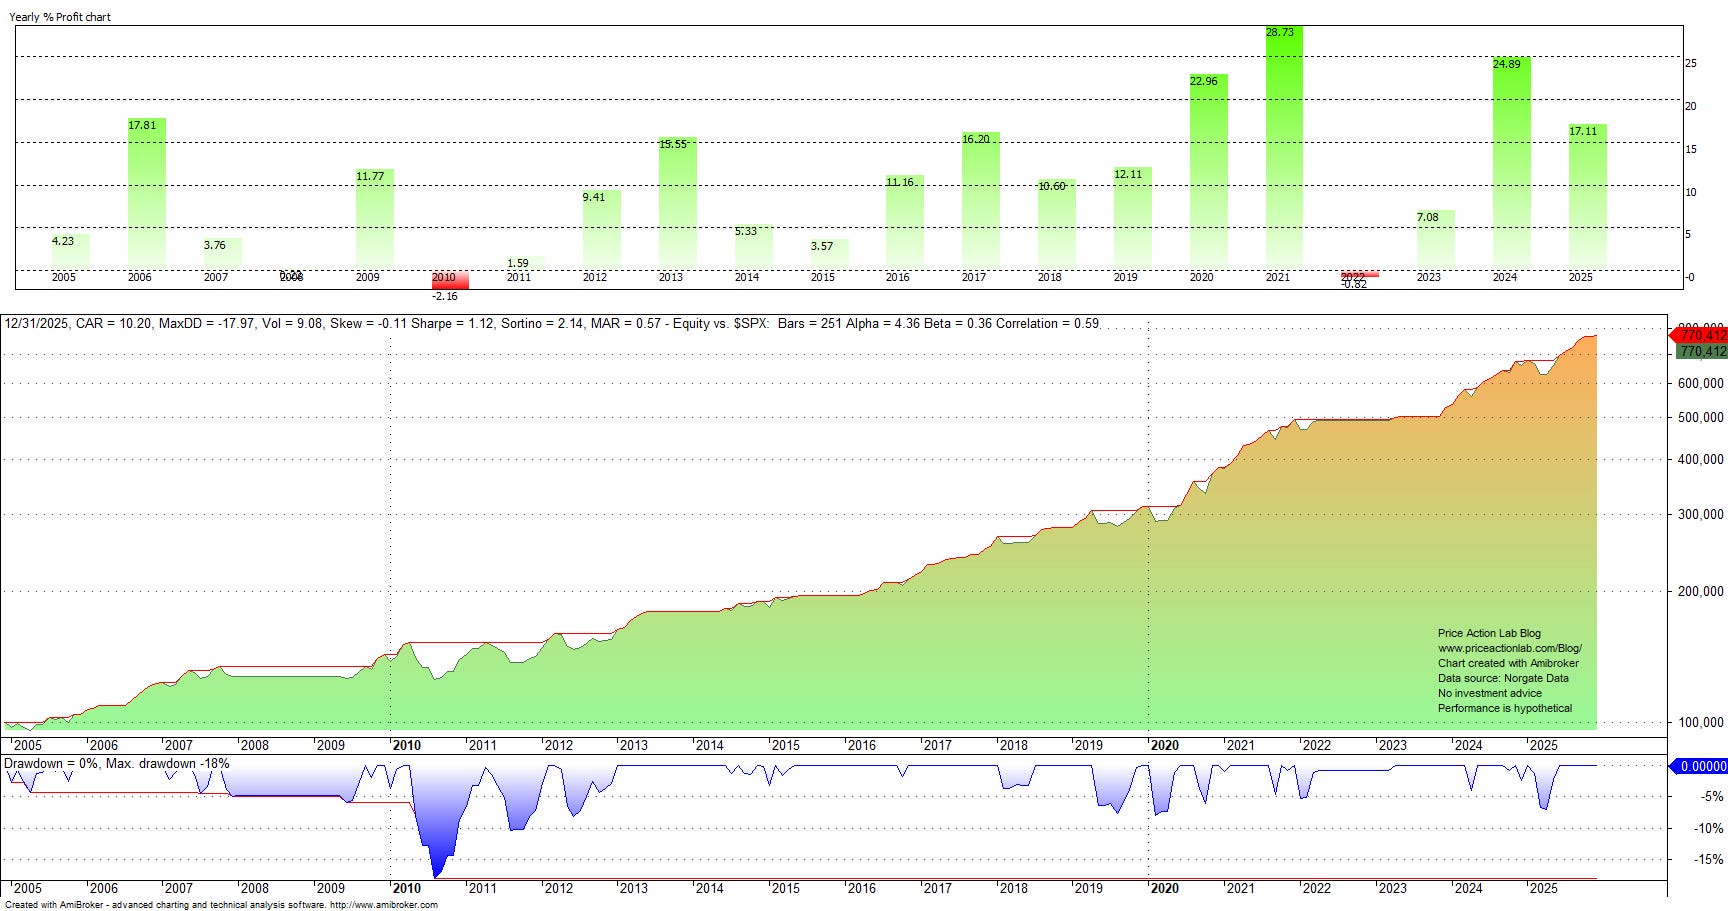
3. The 0-Beta bundle gained 6.9% in 2025, with a maximum drawdown at 4.4%.
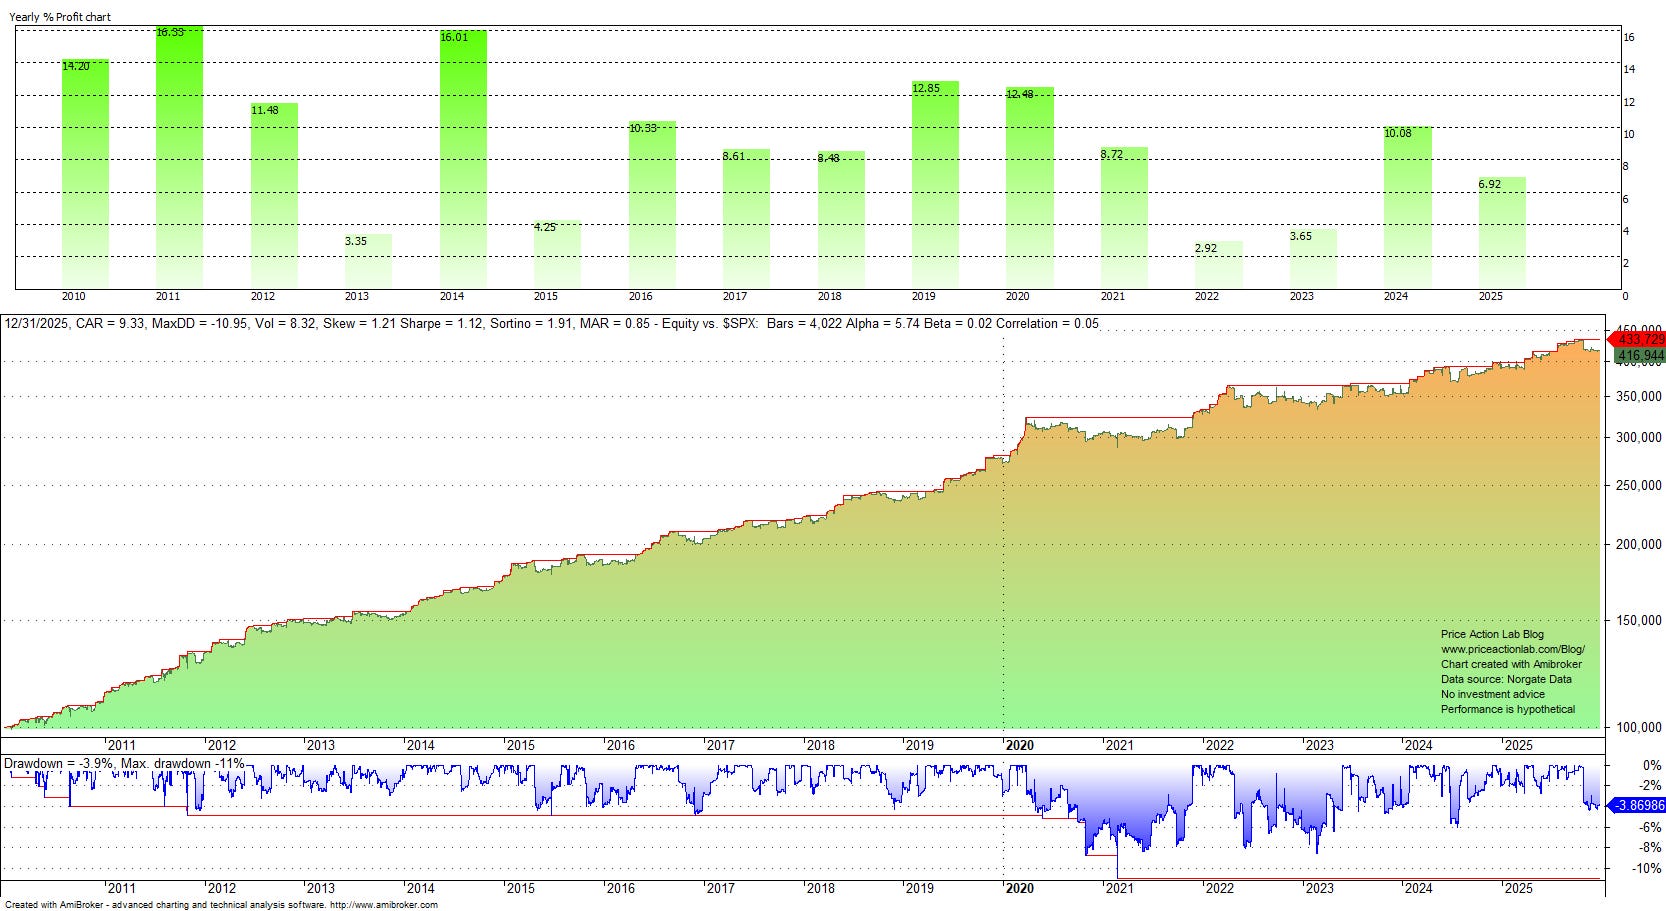
The 0-BETA bundle includes the rules of three strategies. These strategies operate in the daily timeframe
Since 2010, the Sharpe ratio is 1.12, the annualized return is 9.3%, beta is 0.02, and there are no down years. Click here for more details.
4. The futures trend-following strategy gained 13.7% in 2025. Note that this strategy recovered from a 24% maximum drawdown earlier in the year. Last year, the strategy realized its highest return since 1990, of more than 70%.
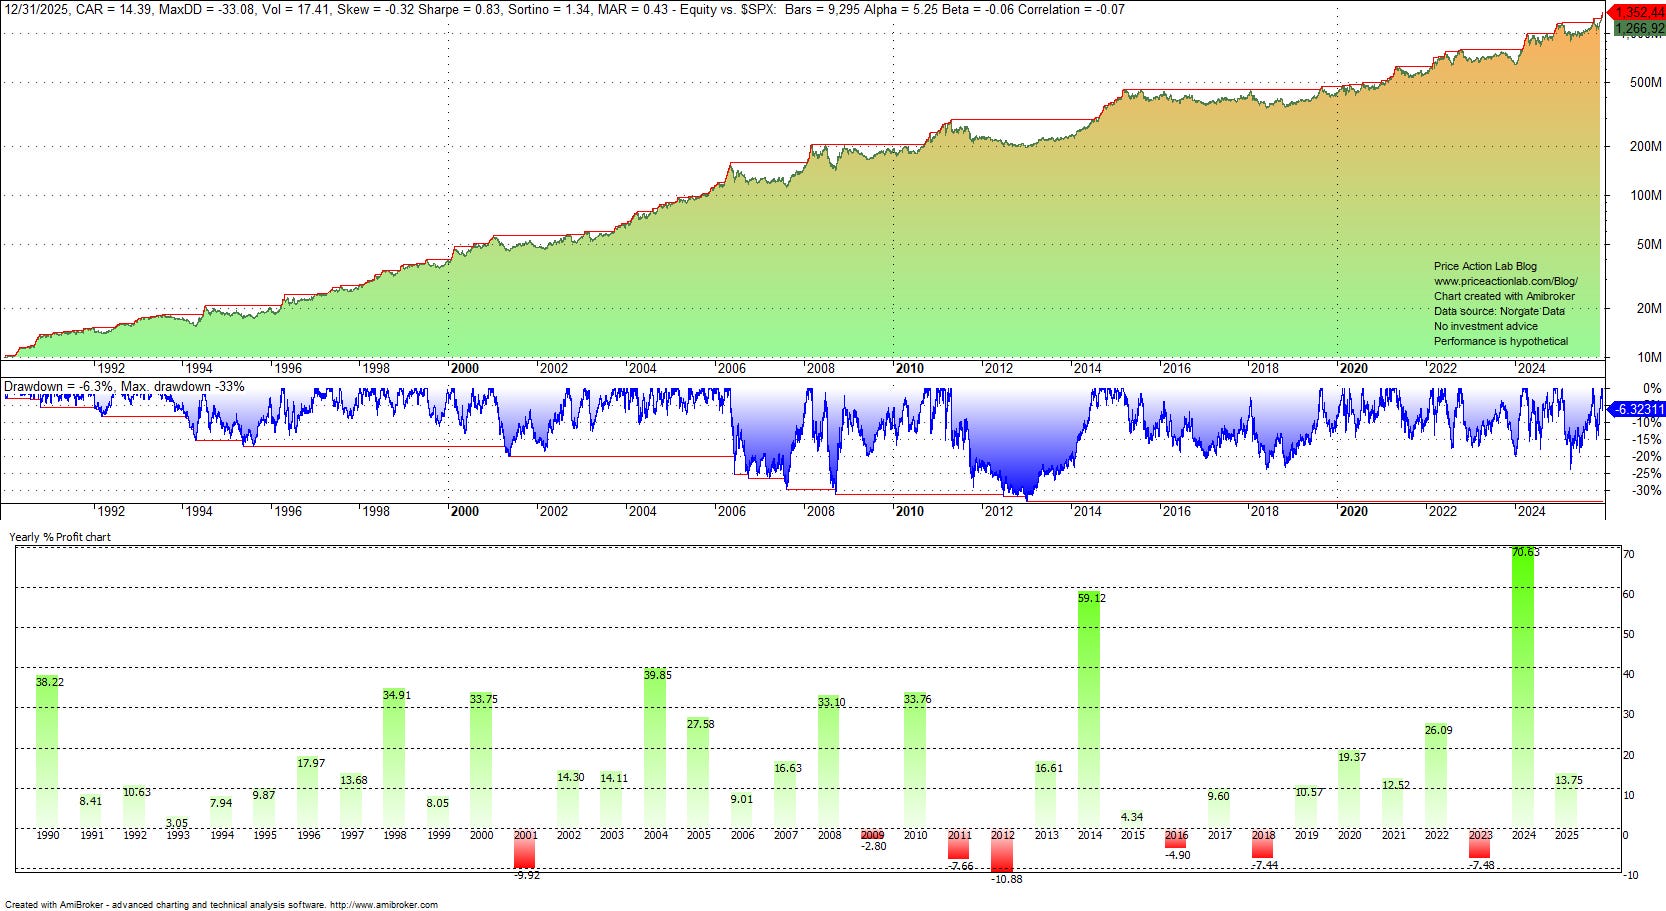
The Sharpe ratio is 0.83, and beta is -0.06. The recovery from the drawdown was mainly due to long positions in precious metals. Currently, there are 15 open positions, 9 long and 6 short. Click here for more details.
Click here for more information about our systematic trading strategies.
Strategy Package
The purpose of the strategy package is to provide traders with informational content that aids in the development of trading strategies, enabling them to become professional traders or even establish their hedge fund. The package provides the rules for a total of 16 trading strategies plus the PSI5 algorithm.
The point about recency bias in strategy evaluation hits home. I've caught myself wanting to abandon systems after a rough month, even when the drawdown is well within historical norms. Curious if you've seen research on optimal "cooling off" periods before evaluating whether a strategy has actually degraded vs just hitting a bad patch?