Macroeconomic analysis (MA) is important to investors in forecasting market trends and making decisions about market allocations and risks.
Four of the key variables used in the macroeconomic analysis include the Gross Domestic Product (GDP), unemployment rates, inflation, and the term structure of interest rates.
Whether MA has been successful is a subject of debate. Many assumptions are part of MA forecasts, and the economic regime is a determining factor in success. For example, after the start of quantitative easing, most models using MA were forecasting high inflation and some hyperinflation. The reasons for the failure were the assumptions and lack of proper context.
Context is important because economies, and especially the US economy, are highly non-linear stochastic processes. Even if compression is available based on several key variables to forecast the medium-term dynamic state of these systems, unexpected events can affect the results. This is what happened due to the 2020 pandemic.
The problem with unexpected events such as the 2020 pandemic is not only that they invalidate forecasts but that they make the distributions of key random variables even more fat-tailed. Here are some examples. We start with the GDP.
The pandemic made both the left and right tails fatter, as may be seen in the above chart. First, GDP collapsed due to the pandemic effects, then surged due to the excessive stimulus. The next chart shows the unemployment level change from a year ago.
Again, due to the pandemic, the right tail got fat with the surge in unemployment. Then, when the pandemic was mostly over, unemployment collapsed, and the left tail got slightly fatter. The next example is the total public debt.
Due to the pandemic stimulus, there was a spike in the percent change in the total public debt. This outlier made the right tail fat.
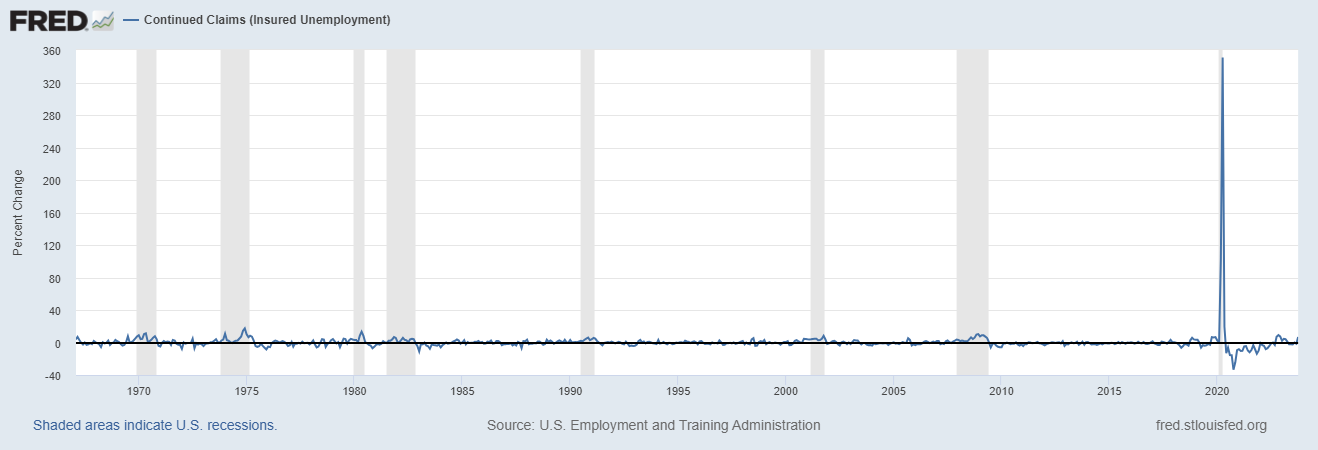
As the tails get fatter, the significance of forecasts diminishes due to wide deviations from normality. Last week, on financial social media, there were forecasts of future economic activity and inflation based on the continued claims, which increased above expectations. Essentially, the forecasters based their analysis on the following series:
However, we are now in the “post-normality” regime. The large spike due to the pandemic has introduced a high level of uncertainty. I will try to make this simpler for everyone, even without any knowledge of statistics, to understand:
It is highly uncertain whether the current changes in the continued unemployment series are due to ripple effects from the significant outlier in 2020 or represent a solid signal. In statistics jargon, it is difficult to calculate confidence intervals due to the high uncertainty. The mean and standard deviation may not even exist when power laws govern the distributions, and even if they do, the required samples for reliable forecasts are enormous. I will try to simplify this in the following way:
We only have one serious pandemic event since 1960 in our series. If we had ten, twenty, or even fifty (God forbid), we would be able to get a more accurate assessment of what may happen next, but even then, context would matter a lot, like whether there were stimulus packages, supply shocks, etc.
MA is more of an art than a science. It assumes foresight above all. Given the tails in the distributions in this new regime, the forecasts are highly uncertain, and critical thinking is necessarily combined with experience. Fat tails paint a hostile regime for simple statistics and indicators like moving averages.
In the Price Action Lab Blog, we offer premium content that includes the weekly Price Action Lab Report and weekly systematic trading signals for ETFs and equities.
By subscribing, you have immediate access to hundreds of articles. Premium Articles and Market Signals subscribers have immediate access to all articles in the trader education section, and All in One subscribers have immediate access to all premium content, including more than 140 Premium Insights articles.
We also offer daily mean-reversion signals for SPY, QQQ, and ZN futures.
Disclaimer: No part of the analysis in this blog constitutes a trade recommendation. The past performance of any trading system or methodology is not necessarily indicative of future results. Read the full disclaimer here.
Charting and backtesting program: Amibroker Data provider: Norgate Data
If you found this article interesting, you may follow me on Substack and X.


Lot of wisdom in this article... thank you for sharing Michael!