
Average True Range or Standard Deviation?
Both are used to size positions.


Traders can use the Average True Range (ATR) or the standard deviation (STDEV) to size positions. Below is a chart of the SPY ETF that shows the 14-day ATR and STDEV and their difference since inception.
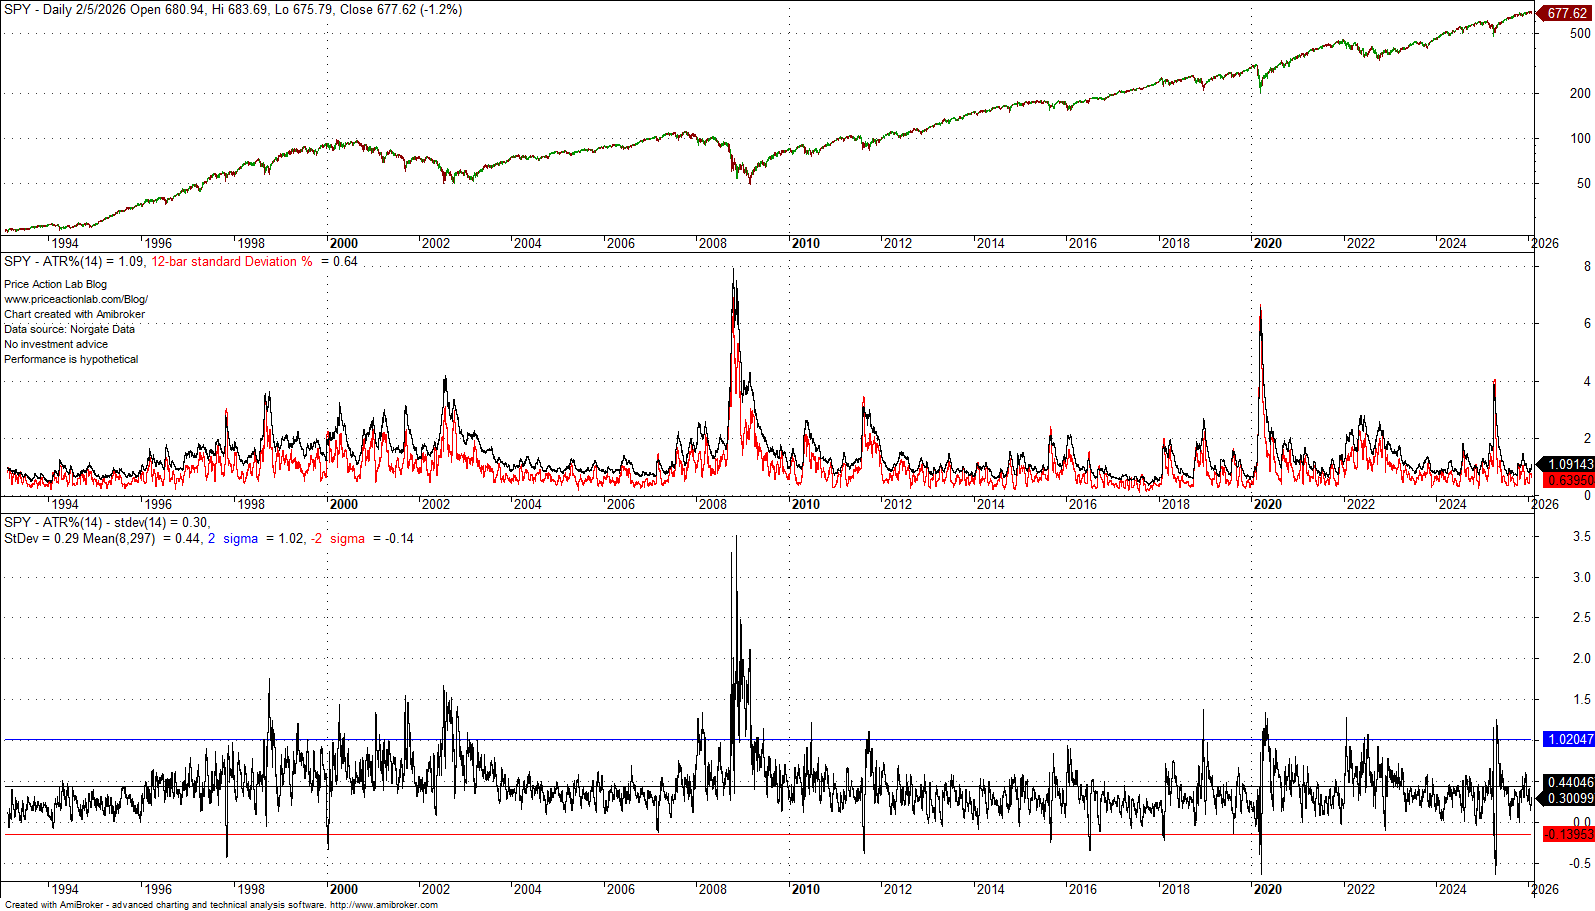
The chart shows small differences with a mean of 44 basis points in favor of the 14-day ATR and a standard deviation of 0.29 basis points. However, here is an important observation: During long bear trends, the difference in favor of ATR has been more pronounced, but the reverse is true during fast corrections.
Below, we change the ATR and STDEV period to 21.
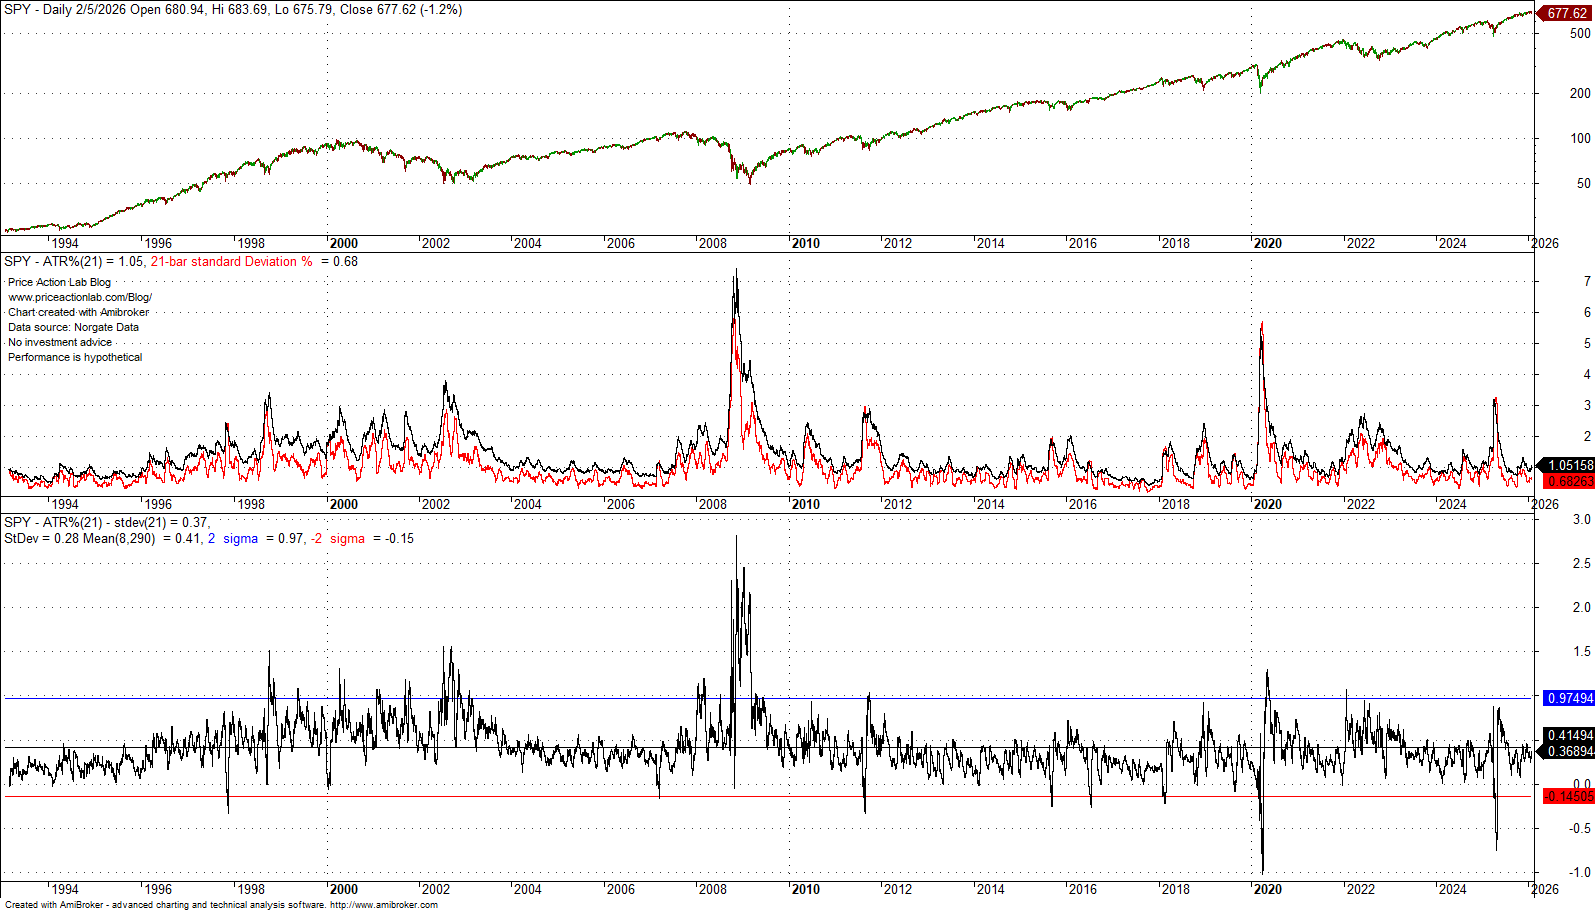
The mean and standard deviation of the difference ATR-STDEV remain approximately the same, at around 41 basis points for the former and 0.29 basis points for the latter. The same observations hold about bear markets and fast corrections: the difference becomes highly positive in the former and highly negative in the latter.
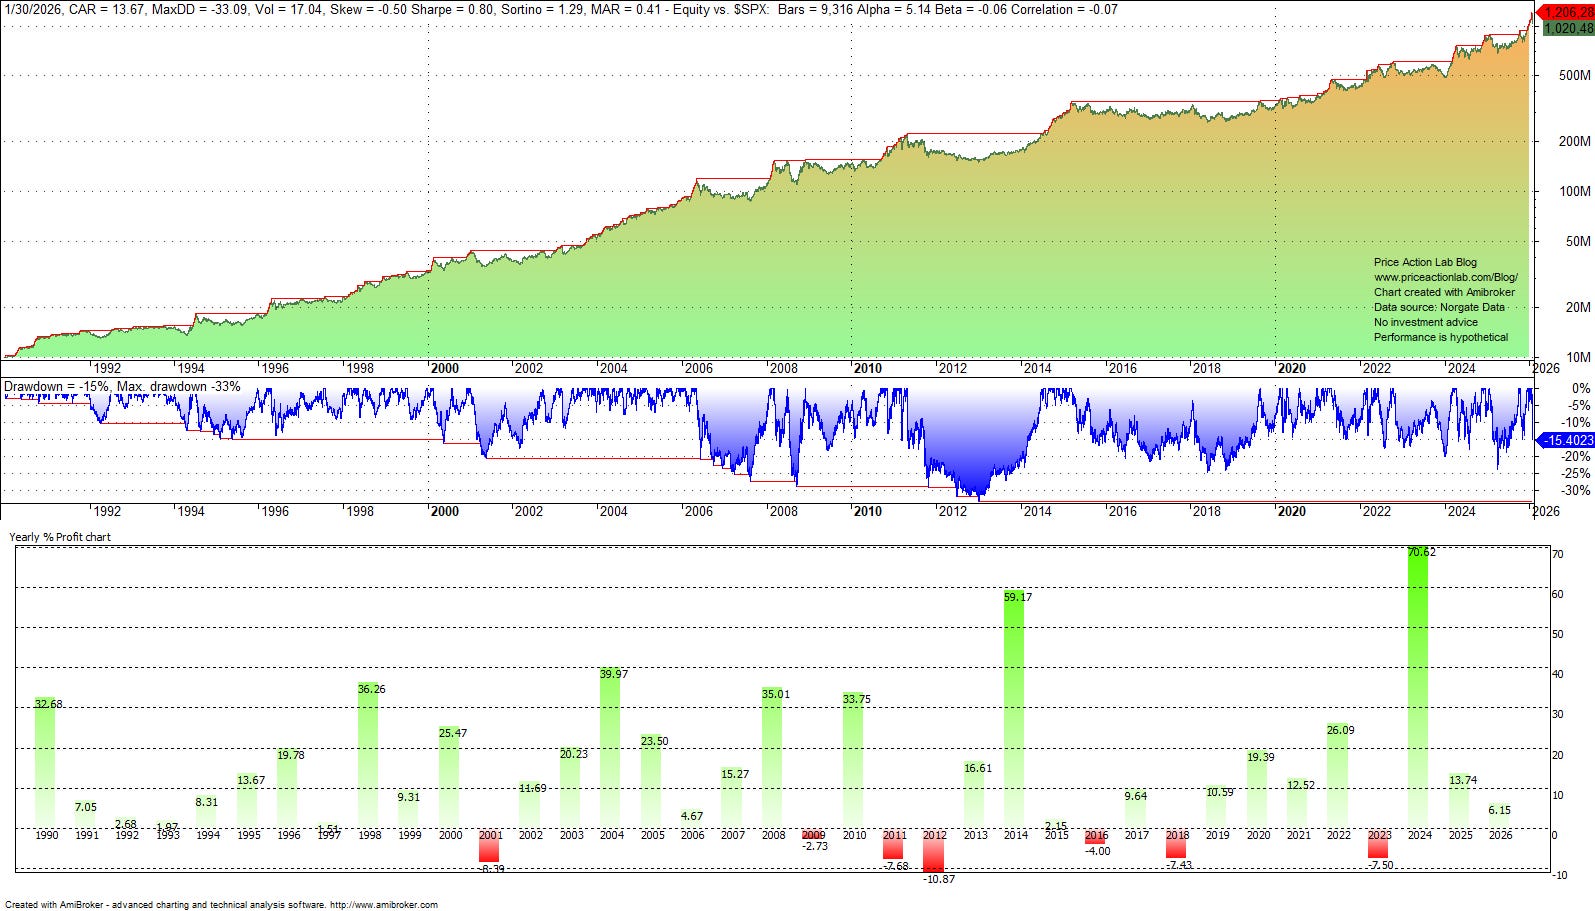
Let us see next how the choice of volatility indicator has affected the behavior of our futures trend-following strategy. First, we size the positions using the ATR.
Next, we use the stdev with the same period to size positions.
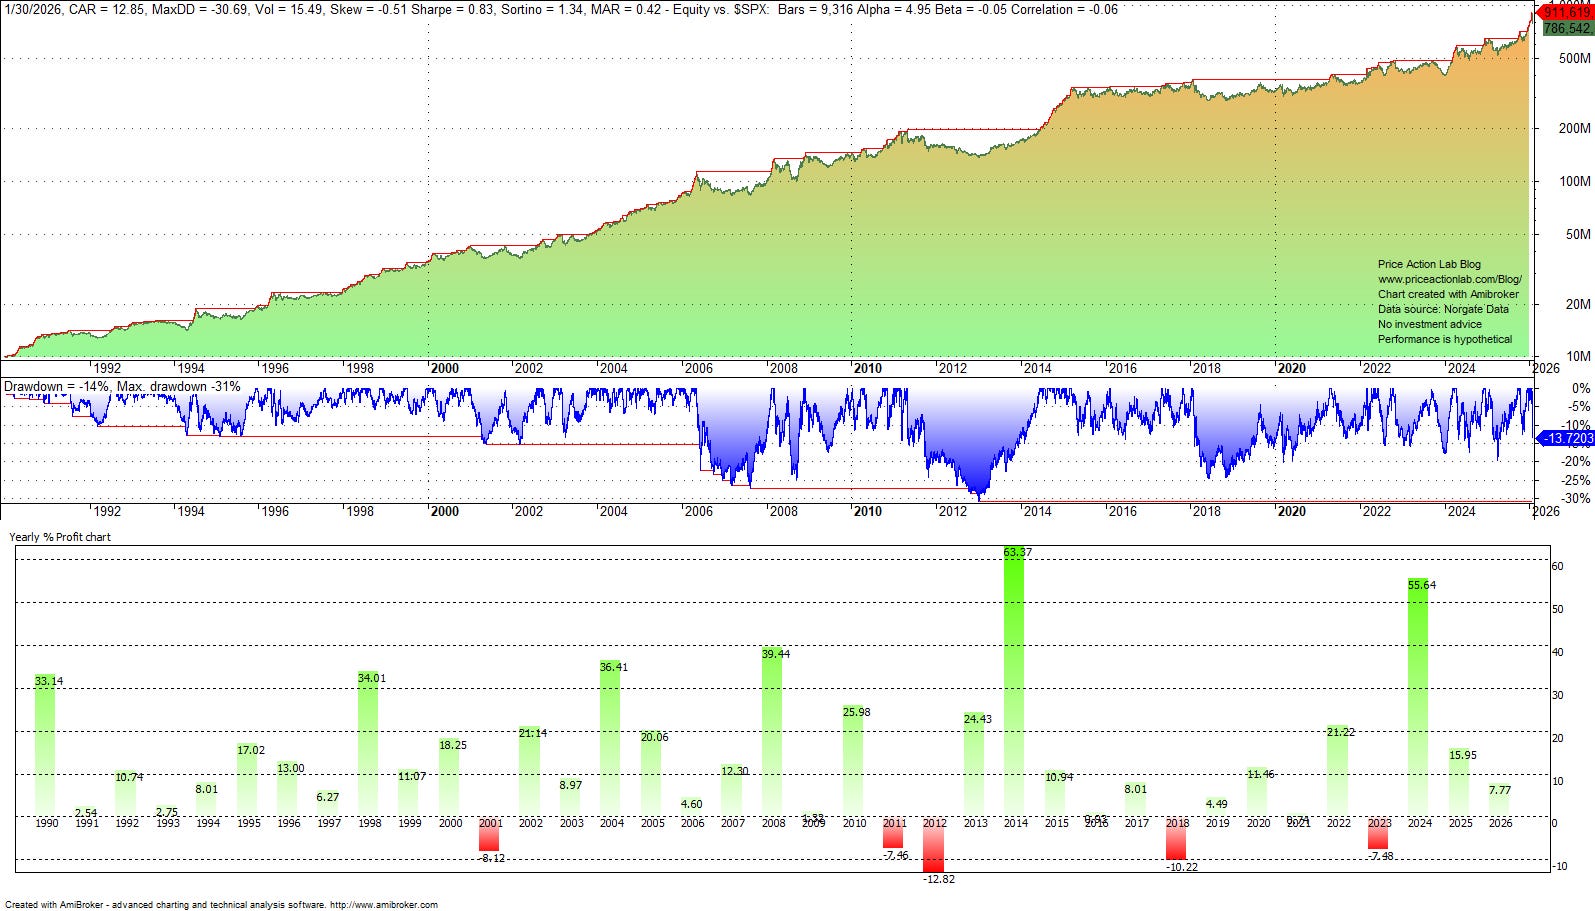
Although there are minor differences, the two performances are statistically indistinguishable. The choice of ATR results in slightly larger positions on average, and the maximum drawdown is slightly higher. All in all, there is no major difference in performance: the Sharpe ratio in the ATR case is only 3 basis points lower.